Everyone knows that buying a home is one of the most expensive and biggest investments in our lives. That’s why smart property investors, buyers and sellers know the importance of analysing pricing trends and relevant information before making a decision.
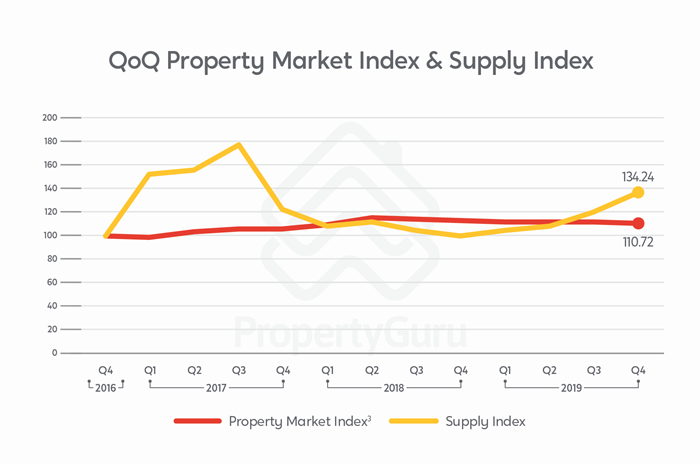
To help you out, we pile a report every quarter known as the PropertyGuru Property Market Index (PMI). Our report piles data from over 200,000 private home listings on PropertyGuru every quarter and compares the average listing prices (Price Index, or abbreviated as SPPI) and the number of non-landed private residential listings (also known as Supply Index, or SPSI).
A recap of the Q3 2019 report
In our previous Property Market Index Q3 2019 report, we found that the wait-and-see period was effectively over as buyers and sellers were instead meeting at ‘halfway prices’. Property prices in the non-landed private property market have been inching downwards, falling by 0.8% to 102.4 in the previous quarter. This was a steady decline since the start of 2019, and a fall of 3.1% year-on-year from Q3 2018.
“The gradual decline in the SPPI for three consecutive quarters since the start of 2019 may be attributed to the efficacy of the cooling measures that the government had introduced,” says Tan Kee Khoon, Country Manager of PropertyGuru. “The most literal and logical explanation of the downward movement is sellers and developers moderating their asking and launch prices to attract buyers.”
Meanwhile, according to official data by the Urban Redevelopment Authority (URA), the URA price index for Q3 2019 has continued to trend upward. Specifically, transaction prices of non-landed private properties increased by 1.3% in Q3 2019, continuing a 2.0% increase in Q2 2019.
What the Q1 2020 report reveals
Asking prices have continued to fall; more listings posted on PropertyGuru
The Property Market Index Q1 2020 (renamed from Q4 2019), looks over key property data points in 2019 and show the trends that may unfold in 2020.
Revealed: The Top 10 Best-Selling Projects in January 2020
Read more here.
Namely, the Property Market Index Q1 2020 report showed that asking prices in the non-landed private residential market continued to fall for the second successive quarter (falling by 0.7% to 110.7). However, the number of listings has also increased, which could suggest that more owners are willing to sell.

Meanwhile, non-landed private residential listings have increased as more sellers were putting their properties up for sale. The Supply Index (SPSI), which tracks the number of non-landed private residential listings posted on PropertyGuru, recorded a gain on 13.3% from 120.2 in Q3 2019 to 132.2 in Q4 2019.
In Q3 2019, the number of listings was 68,979, while Q4 2019 had 78,184, which meant that there was an increase of 9,205 listings.
The FULL List Of Condos Launching In 2020
Read more here.
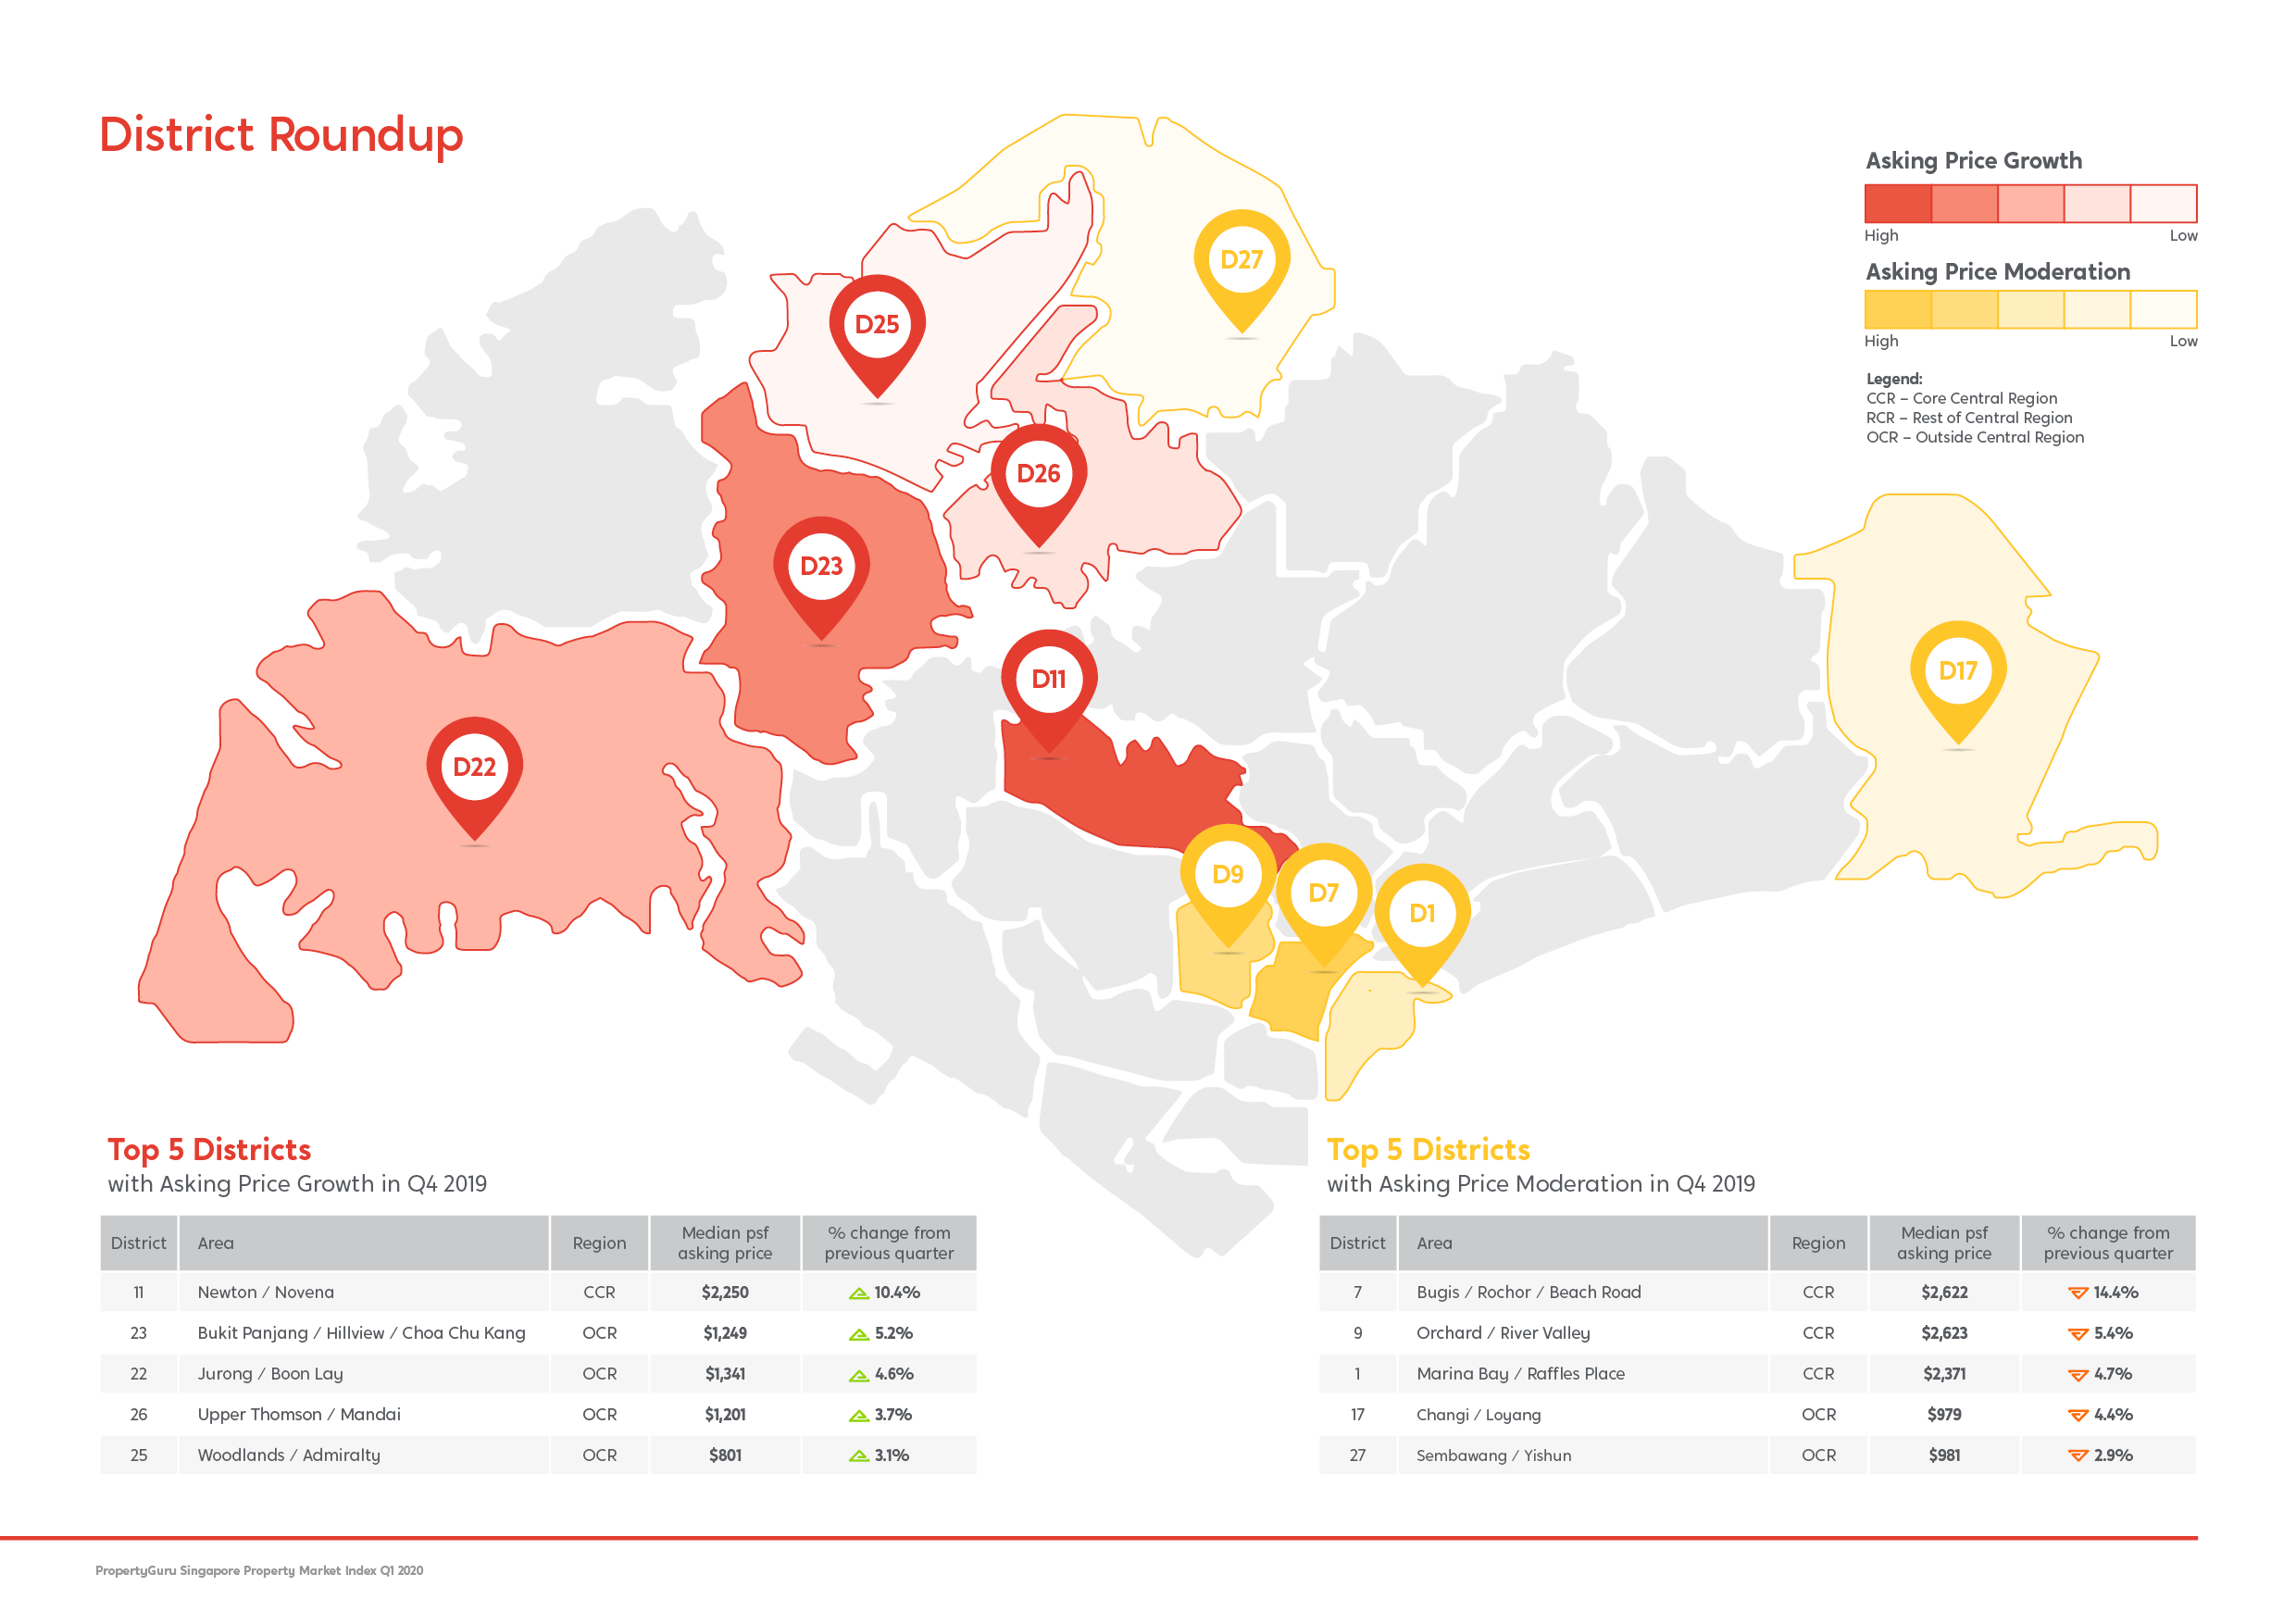
Top 5 Districts with the highest asking price growth in Q4 2019
11
Newton / Novena
CCR
$2,250
10.4% increase
23
Bukit Panjang / Hillview / Choa Chu Kang
OCR
$1,249
5.2% increase
22
Jurong / Boon Lay
OCR
$1,341
4.6% increase
26
Upper Thomson / Mandai
OCR
$1,201
3.7% increase
25
Woodlands / Admiralty
OCR
$801
3.1% increase
Top 5 Districts with asking price moderation in Q4 2019
7
Bugis / Rochor / Beach Road
CCR
$2,622
14.4% decrease
9
Orchard / River Valley
CCR
$2,623
5.4% decrease
1
Marina Bay / Raffles Place
CCR
$2,371
4.7% decrease
17
Changi / Loyang
OCR
$979
4.4% decrease
27
Sembawang / Yishun
OCR
$981
2.9% decrease
3 Districts to look out for in 2020
District 11 (Newton / Novena)
| Q4 2019 q-o-q median psf asking price change | 10.2% increase |
| Q4 2019 media psf asking price | $2,250 |
The Guru View: District 11 had the highest q-o-q increase in Q4 2019, and the 10.2% increase is likely due to transactions of newly launched Neu at Novena and Pullman Residences. There were also 89 resale transactions recorded, which is on par with the 88 transactions recorded in Q4 2018. PropertyGuru foresees demand for homes in D11 to remain buoyant with key amenities (Health City Novena and North-South Corridor) and rising private home prices in District 10.
District 26 (Mandai / Upper Thomson)
| Q4 2019 q-o-q median psf asking price change | 3.7% increase |
| Q4 2019 median psf asking price | $1,201 |
The Guru View: District 26 has recorded the biggest year-on-year pricing growth in Singapore, and it’s not surprising because it will be home to two upcoming Thomson-East Coast Line (TEL) MRT stations in Springleaf and Lentor. Finally, the completion of the North-South Corridor in 2026 could further boost property value in D26.
Will Canberra MRT Kickstart A Property Fairytale?
Read more here.
District 14 (Paya Lebar / Eunos / Geylang)
| Q4 2019 q-o-q median psf asking price change | 0.7% increase |
| Q4 2019 median psf asking price | $1,542 |
The Guru View: District 14 has seen median psf price jumped by 14% over the past three years, spurred by commercial and office developments around Paya Lebar. In terms of property value, 2020 will be a good test to see if buyer demand will sustain; Parc Esta and Arena Residences, for example, saw over 70% of its units sold. Investor-landlords will also be keeping a keen eye on rental demand, with the completion of Park Place Residences likely to set a new bar for rent in D14.
Want to read the full report? Download the PDF version here.
For more property news, content and resources, check out PropertyGuru’s guides section.
Looking for a new home? Head to PropertyGuru to browse the top properties for sale in Singapore.
Need help financing your latest property purchase? Let the mortgage experts at PropertyGuru Finance help you find the best deals.
Disclaimer: The information is provided for general information only. PropertyGuru Pte Ltd makes no representations or warranties in relation to the information, including but not limited to any representation or warranty as to the fitness for any particular purpose of the information to the fullest extent permitted by law. While every effort has been made to ensure that the information provided in this article is accurate, reliable, and complete as of the time of writing, the information provided in this article should not be relied upon to make any financial, investment, real estate or legal decisions. Additionally, the information should not substitute advice from a trained professional who can take into account your personal facts and circumstances, and we accept no liability if you use the information to form decisions.


