


By David Dickinson
PropertyGuru’s recent Sentiment Survey pointed to a trend for Singapore’s Millennials (people that reached adulthood after year 2000) to move out of their family homes at an earlier age. As Millennials are important for the housing market, I thought it might be interesting to take a closer look at what they have been up.
A few years ago, researchers in the US noticed that Millennials there were not leaving home and forming households at the rate previous generations of twenty to thirty something year old’s had done. According to Goldman Sachs[i], roughly 27% of adults under 34 years of age in the US lived with their parents in 2006 but by 2012 the percentage had increased to over 31%. This might not sound like much of a change, but it translated into a lot of housing in the US.
What was happening? Did they lack the housing aspirations of their forebears? In the US it was initially thought to be related to the economic impact of the Global Financial Crisis (GFC), but as the US economy started to improve housing demand from millennials didn’t pick up very much[ii]. Similar observations were made in the UK[iii] with high housing prices also thought to have contributed to falling housing demand from Millennials. In Australia[iv] extremely high housing prices in some cities has also crimped housing demand from younger adults as they struggled to save for ballooning home deposits.
Singapore’s Millennials
What has been happening amongst Singapore’s Millennials? Lets first look at marriage rates because these are often used as an indicator of housing demand.
Over the last 18 years more Singaporeans in the Millennials age group have stayed single. Figure 1 the red line shows singles increasing from about 50% of the 20 to 34 year old population in 2000 to about 67% in 2014, before falling to about 65%.
- Marital status of Singapore’s population aged 20 to 34
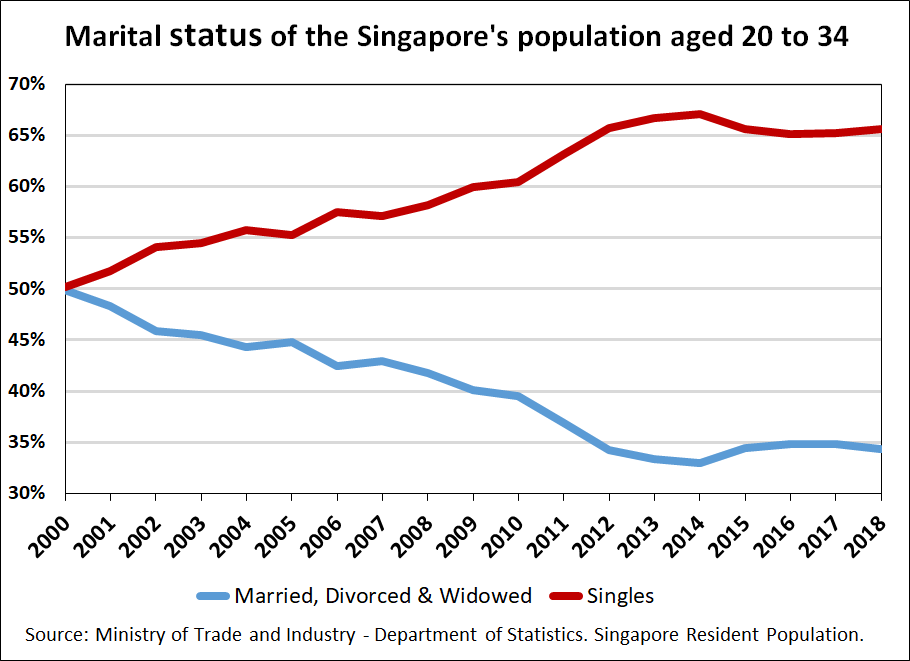
Figure 1
As a result the mostly married population shown in the blue line has fallen. To what extent did the fall in the rate of marriage amongst the Millennial aged population affect housing demand in Singapore? One way to answer this is to figure out how many Millennials had their own places to live over the same time period.
Luckily Singapore’s Department of Statistics collects the information we need in their surveys of households. The surveys ask for one adult to be nominated as the “head of household” amongst all the adults in a household. This can be the oldest person, main income earner, the owner[v], or person who manages the affairs of the household. For example if a:
- single person lives alone then that person must be the “head of the household”,
- husband and wife live together then one of them will be nominated as the “head of the household”. You can imagine the arguments whey they fill in the survey form!
- married couple are living in the home of a parent, then a parent would normally be the nominated “head of the household”.
So when the occupants of all households are surveyed, we can calculate the proportion of any group in the population that call themselves “head of a household” and then divide it by the total population of the group. So if all the population group being examined was married and lived in their own household without parents, then 50% of that population group would head a household. We call this the “headship ratio” and for this group it would be 0.5.
This is a very useful measure[vi], especially when it changes over time. If the ratio goes up then more housing is being utilised on a “per-adult” basis, and less housing if the ratio goes down.
Figure 2 shows fluctuations in Singapore’s “headship ratio” for two groups from year 2000 to 2018. The first is for the total adult population shown by the orange line on the left-hand axis, and the second is for people aged 20 to 34 by the blue line on the right-hand axis. I also show a dotted trend line for the 20 to 34 year age group because the surveys contain some error.
- Household Headship Ratios – Singapore Resident Population 2000 to 2018
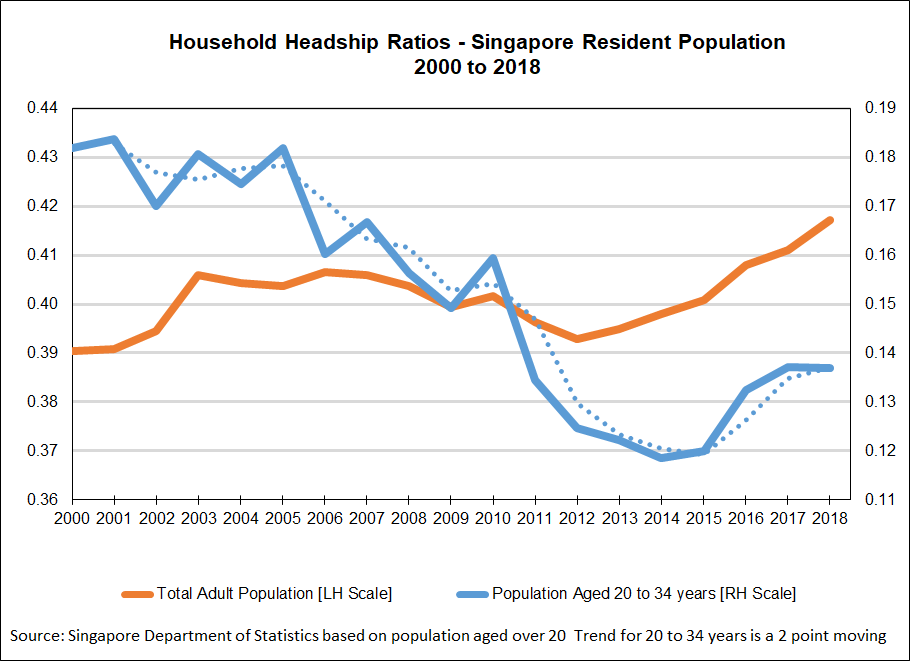
Figure 2
The headship ratio for the total population has risen since 2000 from 0.39 to just under 0.42 in 2018, though it fell from about 2006 to 2012 before rising again.
The changes for Millennials aged 20 to 34 was different. The ratio was highest in the 2000 to 2005 period at around 0.17 to 0.18 before declining to roughly 0.12 in 2014/2015 and then recovering to almost 0.14 in 2017 and 2018.
This shows that the rate of household formation amongst Singapore’s Millennial age group has fallen more or less in line with the proportion of the their population that was married. It even ticked up after 2014 when marriage rates also increased.
Clearly, marriage rates are very important to housing demand from Millennials in Singapore, though it may not be so simple.
While I doubt the GFC affected Singapore’s Millennials as directly as it impacted US Millennials, housing prices may have been a significant contributor like in Australia and the UK. In Singapore housing prices increased by about 90%[vii] from about 2004 to 2013, before falling steadily after curbs were introduced to slow the market.
Since many young Singaporeans have access to subsidised home ownership through the Housing Development Board (HDB), the supply of new flats might also help explain the fall. HDB new flat supply was less than 9,000 units a year from 2004 to 2013, before rising to about 21,000 a year after 2013. Similarly, private non-landed housing stock increased from about 6,000 units a year to more than 14,000 units over the same periods.
While the marital status of the Millennial-aged population is very central to housing demand in Singapore, it might not fully explain the up-tick in the headship ratio after 2014. Apart from falling rents and house prices from 2013 to 2017, the surge in small “shoebox” condominium construction in recent years may also be helping lift demand as they provide more lower-cost private housing options, especially in the rental sector. The number of private apartments and condominiums leased for $2,000 a month or less has increased substantially from about 1,300 leases in 2014 to over 11,000 in 2018. This, together with falling rents generally might have encouraged more Millennials to leave home and set up their own households.
So there you have it. Millennials in Singapore did consume less housing in line with patterns in other countries, but not necessarily for all the same reasons. The up-tick in the headship ratio in Singapore since 2014 was probably due to a rise in the rate of marriage, falling rents and housing prices from 2013, and increasing supply of HDB and private housing.
PropertyGuru’s Sentiment Survey results showing more Millennials moving out of their family homes seems to marry with this. No pun intended.
Next time I will take a look at how Singapore’s Millennials compare to other countries when it comes to housing demand.
[i] Goldman Sachs Equity Research, August 4 2014, “Millennials: The Housing Edition”, Exhibit 16.
[ii] This has been noted by various authors. For example: Natalia Siniavskaia, “2.4 Million Millennial-led Households are missing”, National Association of Home Builders, July 13, 2018. http://nahbnow.com/2018/07/2-4-million-millennial-led-households-are-missing/
[iii] RTPI Research Report No. 1, January 2014. “Planning for Housing in England: Understanding recent changes in household formation rates and their implications for planning for housing in England”.
[iv] Daniel Gradwell, “Australia’s housing affordability is distorting demand figures: Daniel Gradwell”, in Property Observer, 25 Sept. 2017. https://www.propertyobserver.com.au/forward-planning/advice-and-hot-topics/76383-australia-s-housing-affordability-is-distorting-demand-figures-daniel-gradwell.html
[v] The owner if the dwelling is owner-occupied or possibly the tenant whose name is on the lease.
[vi] Now just to be clear, one household does not always equal one house or apartment because separate households can share.
[vii] The URA price index of All Private Residential Properties increased by 88% from Dec. 2004 to Dec. 2014, while the HDB resale price index rose by almost 89% over the same period.
Disclaimer
The views and opinions expressed in this article are those of the author and do not constitute investment or financial advice. Whilst every effort has been made to ensure that the information provided is accurate, individuals must not rely on this information to make investment or financial decisions.
The author and PropertyGuru do not give any warranty as to the accuracy, reliability or completeness of information which is contained in this article. Except insofar as any liability under statute cannot be excluded, the author, PropertyGuru and its employees do not accept any liability for any error or omission in this article, or for any resulting loss or damage suffered by any person or organisation.
Home buyers looking for Singapore Properties may like to visit our Listings, Project Reviews and Guides. Also read more about the hottest areas to live in with PropertyGuru’s AreaInsider
Disclaimer: The information is provided for general information only. PropertyGuru Pte Ltd makes no representations or warranties in relation to the information, including but not limited to any representation or warranty as to the fitness for any particular purpose of the information to the fullest extent permitted by law. While every effort has been made to ensure that the information provided in this article is accurate, reliable, and complete as of the time of writing, the information provided in this article should not be relied upon to make any financial, investment, real estate or legal decisions. Additionally, the information should not substitute advice from a trained professional who can take into account your personal facts and circumstances, and we accept no liability if you use the information to form decisions.