


By David Dickinson
Lets start by taking a snapshot of marriage rates amongst Millennials in Singapore, the US, Australia, Hong Kong, Japan and Korea.
First the good news. Millennials here help make Singapore a wedding planner’s paradise. Together with Japan about 33% of Millennials aged 20 to 34 years are married and top our comparison in Figure 1. They are followed by the US, Australia and Hong Kong at around 30% married, while Korea’s Millennials don’t seem so keen to get married, lagging well behind at under 24%.
 Figure 1
Looking more closely at marriage rates within Millennial age groups in Figure 2 we see that while Singaporeans are keen to marry, they are slow starters with only 2.6% of 20 to 24 year olds married (see the blue bars in the chart), though once they reach 30 they are much keener to “find a mate” with almost 67% of 30 to 34’s married (the green bars in the chart).
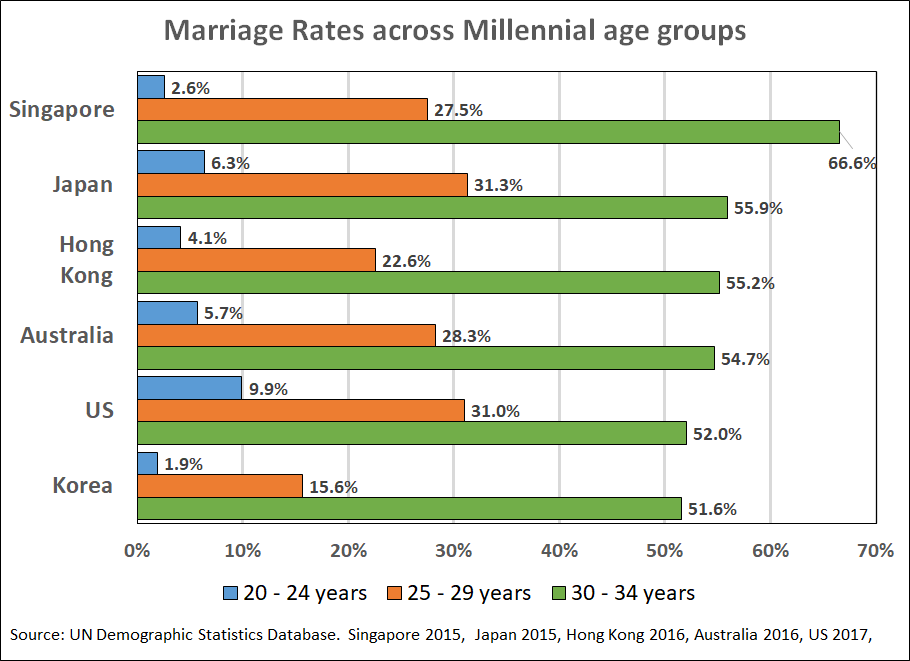 Figure 2
In contrast Millennials in the US are early starters with almost 10% of 20 to 24 year old’s married, though a much lower 52% are married by age 30 to 34. Older and wiser perhaps.
Koreans don’t seem very keen to marry, especially before they are 30! Only 1.9% of 20 to 24’s are married, and the rate rises to only 15.9% for 25 to 29 year olds. However in the first half of their 30’s they get much keener, with the marriage rate rising to almost 52%, and on-par with the US. Perhaps there is something ominous about being over 30 and still single.
What does this mean for housing demand? You will recall from the last article I used a statistic called a “headship ratio” that showed the proportion of Millennials in Singapore that “head a household”. The larger the ratio, the more housing is owned or rented.
Figure 3 shows headship ratios for Millennials (the blue bars) as well as for the total adult population (the red bars) for Singapore, Hong Kong, Korea, Australia, Japan and the US at similar points in time.
 Figure 3
Singapore has the lowest level of household headship for Millennials at only about 0.14 while the US is the top at about 0.38. This is a huge difference.
The headship ratio for the adult population as a whole varies from a low of 0.42 in Singapore to about 0.52 in the US. You can think of this as Americans “consuming” about 20% more houses per adult than Singaporeans.
The very large difference between the blue and red bars in Singapore shows that a lot of people form households over the age of 34, whereas in Australia, Japan and the US many have done so by that age.
So while Singapore’s Millennials have a relatively high rate of marriage, their rate of household formation is relatively low compared to other countries. This seems a bit contradictory so what’s going on?
Firstly, young Singaporeans are likely to enter the workforce at an older age than young adults in other countries due to high rates of university attendance[i] and National Service for men.
Also, young adults here can live with their parents while going to university and after getting a job. In larger countries (geographically speaking) this is much less likely, so their headship ratios are likely to be higher.
This begs the question of why do Hong Kong’s Millennials have noticeably higher household headship ratios than Singapore’s, given it’s also relatively small in geography. The answer, I think, is due to differences in population groups included in household surveys and census in each country. In Singapore about 381,000 foreigners[ii] on Employment (EP) and S Passes are not included in statistics on households whereas in Hong Kong foreigners in professional and semi-professional jobs are included. If these groups were included in Singapore’s surveys, I suspect the ratios would be much closer. We know that foreigners are significant users of private housing here[iii].
Also, unique to Singapore is the role the HDB plays in shaping household formation. Access to subsidies and ownership is available to married couples from age 21 whereas most singles qualify from age 35 and this also may help explain why the headship rate for Millennials here are lower than in other countries and why household formation is relatively higher for the over 35’s here.
So even with high rates of marriage, Singapore’s Millennials are relatively slow starters in the housing market if other countries are used as a yardstick. It’s probably due to them being able to live with their parents even after starting work together with a combination of things that are “unique” to Singapore, such as HDB and national service for men.
Till next time.
[i] In 2016, 54% of Singapore’s population aged 25 to 34 had a university qualification, compared to OECD estimates of 20% in Korea, 42% in the US, 40% in Japan and 35% in Australia.
[ii] As at December 2018.
[iii] For example roughly 30% of occupied private non-landed housing would be utilised by non-resident households after the number of resident households occupying the same type of dwelling is subtracted. This assumes each household occupies a separate dwelling.
Disclaimer
The views and opinions expressed in this article are those of the author and do not constitute investment or financial advice. Whilst every effort has been made to ensure that the information provided is accurate, individuals must not rely on this information to make investment or financial decisions.
The author and PropertyGuru do not give any warranty as to the accuracy, reliability or completeness of information which is contained in this article. Except insofar as any liability under statute cannot be excluded, the author, PropertyGuru and its employees do not accept any liability for any error or omission in this article, or for any resulting loss or damage suffered by any person or organisation.
Disclaimer: The information is provided for general information only. PropertyGuru Pte Ltd makes no representations or warranties in relation to the information, including but not limited to any representation or warranty as to the fitness for any particular purpose of the information to the fullest extent permitted by law. While every effort has been made to ensure that the information provided in this article is accurate, reliable, and complete as of the time of writing, the information provided in this article should not be relied upon to make any financial, investment, real estate or legal decisions. Additionally, the information should not substitute advice from a trained professional who can take into account your personal facts and circumstances, and we accept no liability if you use the information to form decisions.