Sentosa Cove: 107 Units for Sale
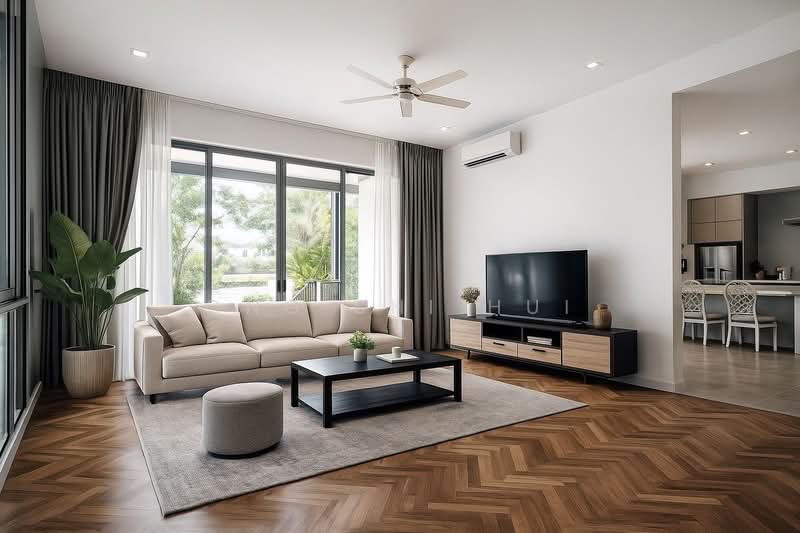
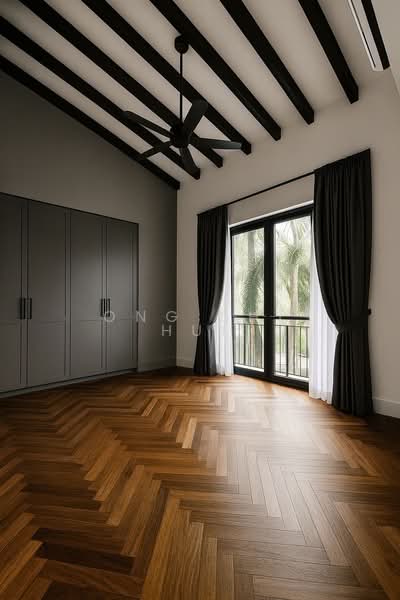
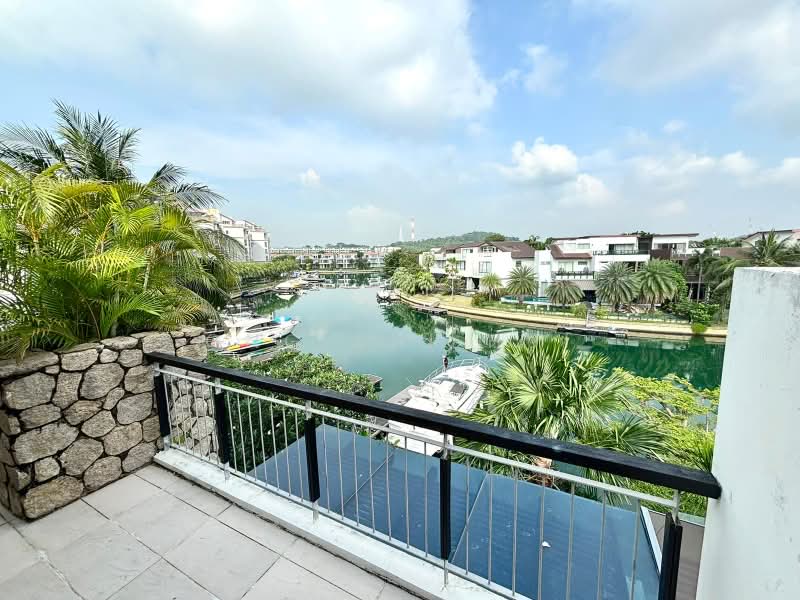
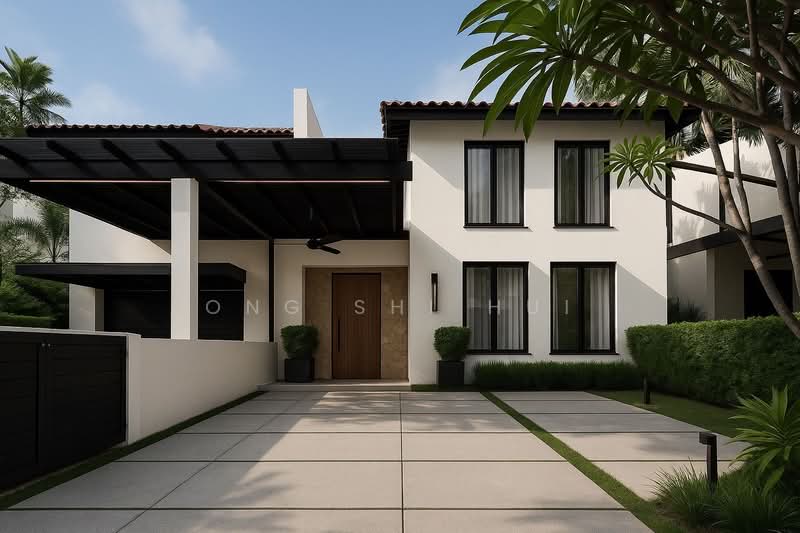
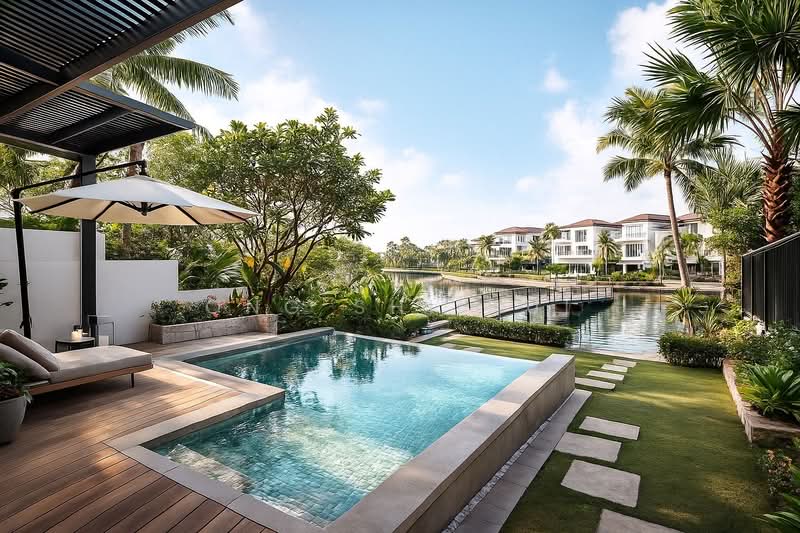
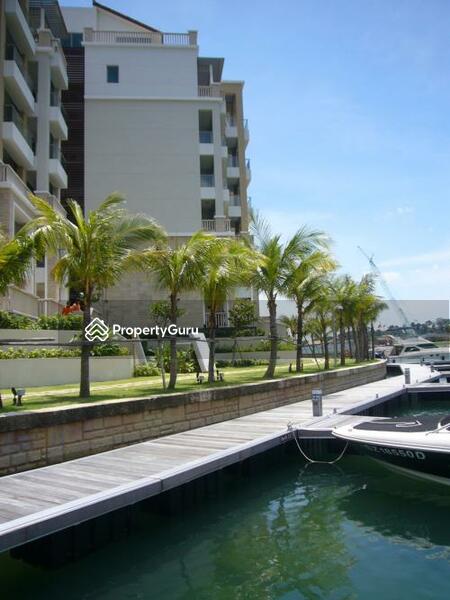
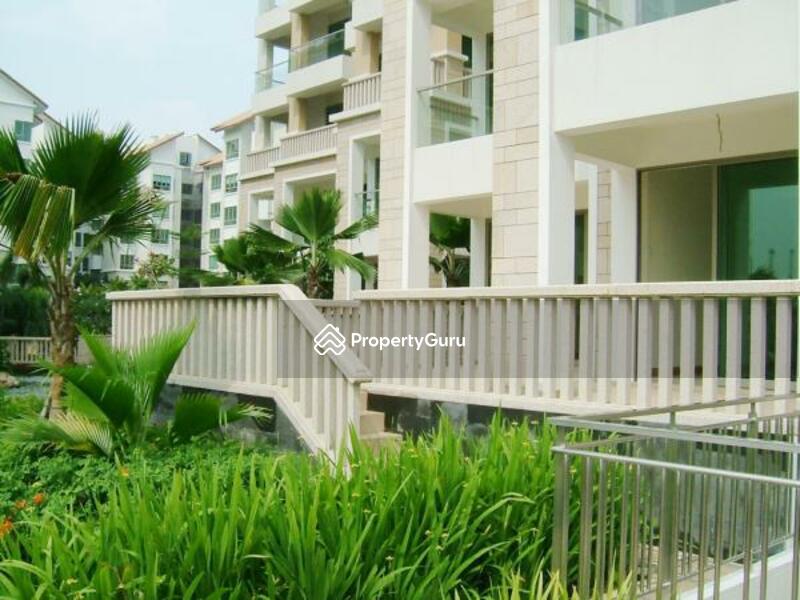
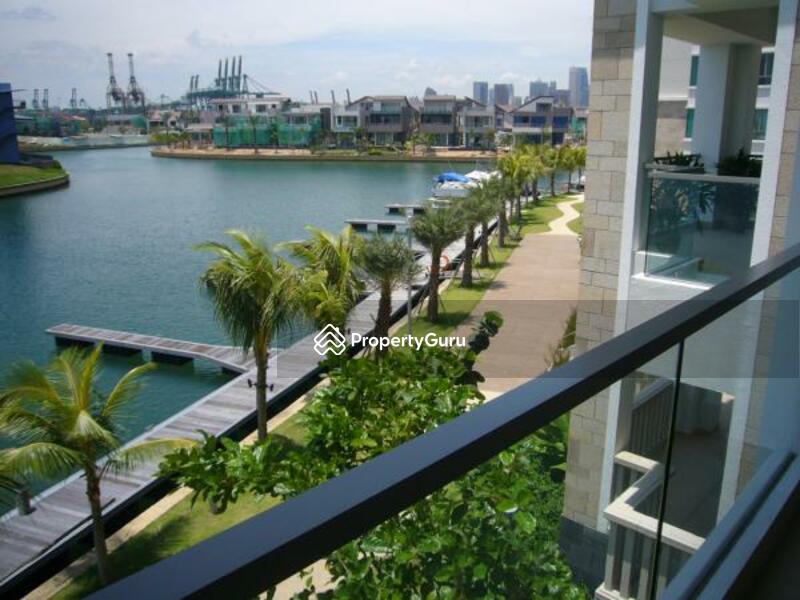
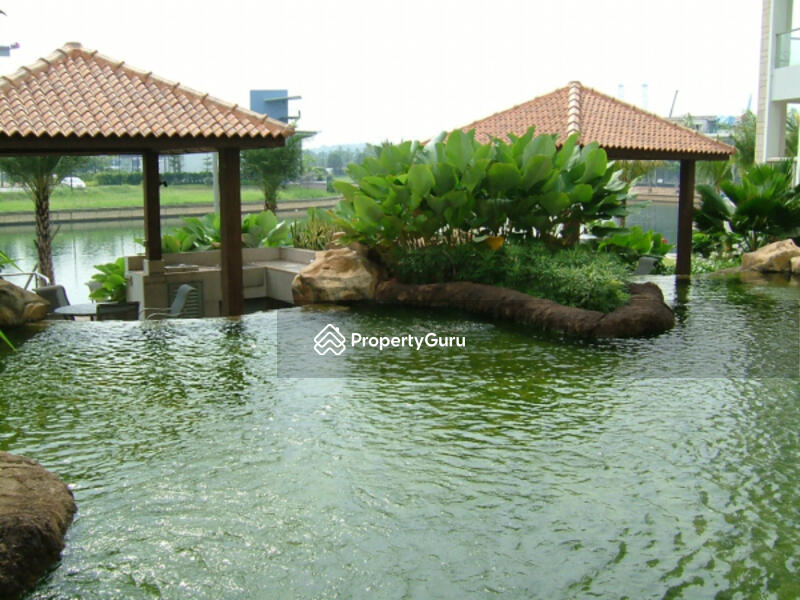
Sentosa Cove is a leasehold detached house development that is located at Ocean Drive in District 4. It is a mature development of a medium rise detached house building. The project was completed in the year 2011 with 249 units available. The detached house is located close to public transportation that allows residents to move easily from one place to another from the detached house. There are many shops and amenities close to the detached house which would ease the process for residents and they do not need to go far to find what they need. - Sentosa Cove is a beautiful detached house that has many charms to it. There are various facilities that residents can enjoy while living in Sentosa Cove. Residents of Sentosa Cove would not have to travel far to get their basic necessities as everything is close by. Residents can enjoy lap pool, leisure pools with Jacuzzi, reflecting pools, wading pool, gymnasium, steam rooms, barbeque area, Pavilions, cascading landscaped courtyard, lotus pavilion, Koi pond, function room and berths. The houses come with car parks as well for each of the houses. The housing development is well equipped with 24 hours security system as well. There is a number of public transportation close to Sentosa Cove that residents can make use of. The closest bus stops are located at W Singapore and Sentosa Cove Village. For those with vehicles, the shopping district located at Orchard Road can be easily accessed via Eu Tong Sen Street and Tanglin Road in about 25 to 30 minutes. Greenwood Fish Market @ Quayside IsleGrilladoGreater Lot by CedeleEarl of HindhTwo Chefs Bar Mexican & Italian Eis International Pre SchoolEtonhouse International School SentosaIslander Pre SchoolQuayside Isle Preparatory SchoolStand Up Paddling School Quayside IsleVivoCity100 AMMarina SquareThe Shoppes at Marina Bay Sands Cold Storage Sentosa CoveJasons The Gourmet GrocerCold Storage HarbourFront CentreFairPrice Tanjong Pagar PlazaAl Marche Sentosa Cove is a detached housing development that is made up of a total of 249 housing units. There are 2 unit types available with various layouts that residents can browse through. The sizes for the units range between 1,916 square feet to 3,122 square feet. The layouts for the units in Sentosa Cove aim to provide residents with homes that is comfortable for working adults, couples or families looking to own a spacious and manageable detached house unit. The rental price for the units in Sentosa Cove averages at S$ 78,000,000. The rental price for the houses ranges between S$ 12,800 to S$39,000. Project Name: Sentosa CoveType: Detached houseDistrict: 04Configuration: 249 residential units Unit Types:3bedrooms (1,916 sqft 2,121 sqft)4 bedrooms (2,336 sqft 3,122 sqft) The following developments are in the same neighborhood as Sentosa Cove:Reflections at Keppel BayCaribbean at Keppel BayThe InterlaceCorals at Keppel BaySentosa CoveThe Oceanfront @ Sentosa Cove
Explore PropertyGuru
The development continues to feature in recent search behaviour across the Harbourfront / Telok Blangah market, according to PropertyGuru's 30-day search trends. This project maintains notable traction in local search behaviour, recording a 15.78% share within the district.
Most-searched Units: 3-BedroomPopular preferences: Tennis Court, Air-Conditioning, Private Pool
Pricing by Unit Types:
- 3-Bedroom Units:
- Avg Asking Price: S$ 21.40M
- Avg PSF: S$ 2,710 psf (64.64% higher compared to Harbourfront / Telok Blangah average of S$ 1,646 psf)
- Available Units: 2
- 4-Bedroom Units:
- Avg Asking Price: S$ 18.49M
- Avg PSF: S$ 2,580 psf (31.49% higher compared to Harbourfront / Telok Blangah average of S$ 1,962 psf)
- Available Units: 11
- 5+ Bedroom Units:
- Avg Asking Price: S$ 21.24M
- Avg PSF: S$ 2,531 psf (11.03% higher compared to Harbourfront / Telok Blangah average of S$ 2,279 psf)
- Available Units: 78
- SENTOSA COVE VILLAGE (748m, 8-9 mins) — This stop serves as a handy link for residents to move around the island or head towards the HarbourFront area.
Shopping & Retail:
- COLD STORAGE - SENTOSA COVE (517m, 6-7 mins) — A premium grocery option right in the neighborhood for high-quality fresh produce and daily essentials.
- COLD STORAGE (525m, 6-7 mins) — Another convenient supermarket choice nearby that makes stocking up the pantry quick and easy.
Dining & Food:
- PANAMERICANA (455m, 5-6 mins) — A fantastic spot for residents to enjoy grilled specialties and drinks with a great view just a short walk away.
Convenience Stores:
- 7-ELEVEN (533m, 6-7 mins) — Perfect for quick snacks, drinks, or last-minute household needs at almost any time of the day.
Highly attractive for: Affluent Professionals, Lifestyle Seekers, Business Owners, Investors
Sentosa Cove maintains its status as a premium residential enclave, though recent transaction data indicates a period of price adjustment.
- PSF Appreciation: S$2,210 → S$2,124 over recent years (-3.89%) from 2023 - 2026.
- Transactions: 1 sale transaction in the last 12 months, showing limited sale activity.
- PG Pulse Insight: With a current median price of S$2,124 and limited sale activity, Sentosa Cove remains an exclusive market segment characterized by low transaction volume and recent price consolidation.
Published date: July 1, 2026